Student of the Market- February 2022
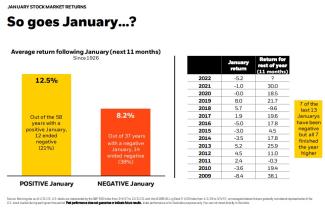
Since 1926, when January has had positive returns, the average return following January over the next 11 months of the year has been 12.5%. Out of the 58 years with a positive January, 12 ended negative (21%). Since 1926, when January has had negative returns, the average return following January over the next 11 months of the year has been 8.2%. Out of the 37 years with a negative January, 14 ended negative (38%). 7 of the last 13 Januarys have been negative, but all 7 finished the year higher.
Even amid market volatility, it is important to stay the course. During Black Monday, the returns for the period were -33.5%. Over the next 12 months, the returns were 21.4%. During the Gulf War, the returns for the period were -19.9%. Over the next 12 months, the returns were 29.1%. During the Asia Monetary Crisis, the returns for the period were -19.3%. Over the next 12 months, the returns were 37.9%. During the Tech Bubble, the returns for the period were -49.0%. Over the next 12 months, the returns were 33.7%. During the Financial Crisis, the returns for the period were -56.8%. Over the next 12 months, the returns were 68.6%. During the Trade War, the returns for the period were -19.6%. Over the next 12 months, the returns were 37.1%. During the COVID-19 Sell Off, the returns for the period were -33.8%. Over the next 12 months, the returns were 77.8%.
From 2/4/94 to 12/31/21, the average performance 12 months following the first Fed hike for U.S. bonds was 3.2%, for short-term bonds was 2.2%, for M-sector bonds was 3.5%, for high yield bonds was 4.5%, and for bank loans was 6.5%.
Click on the link below to read BlackRock's entire, "Student of the Market" report:

